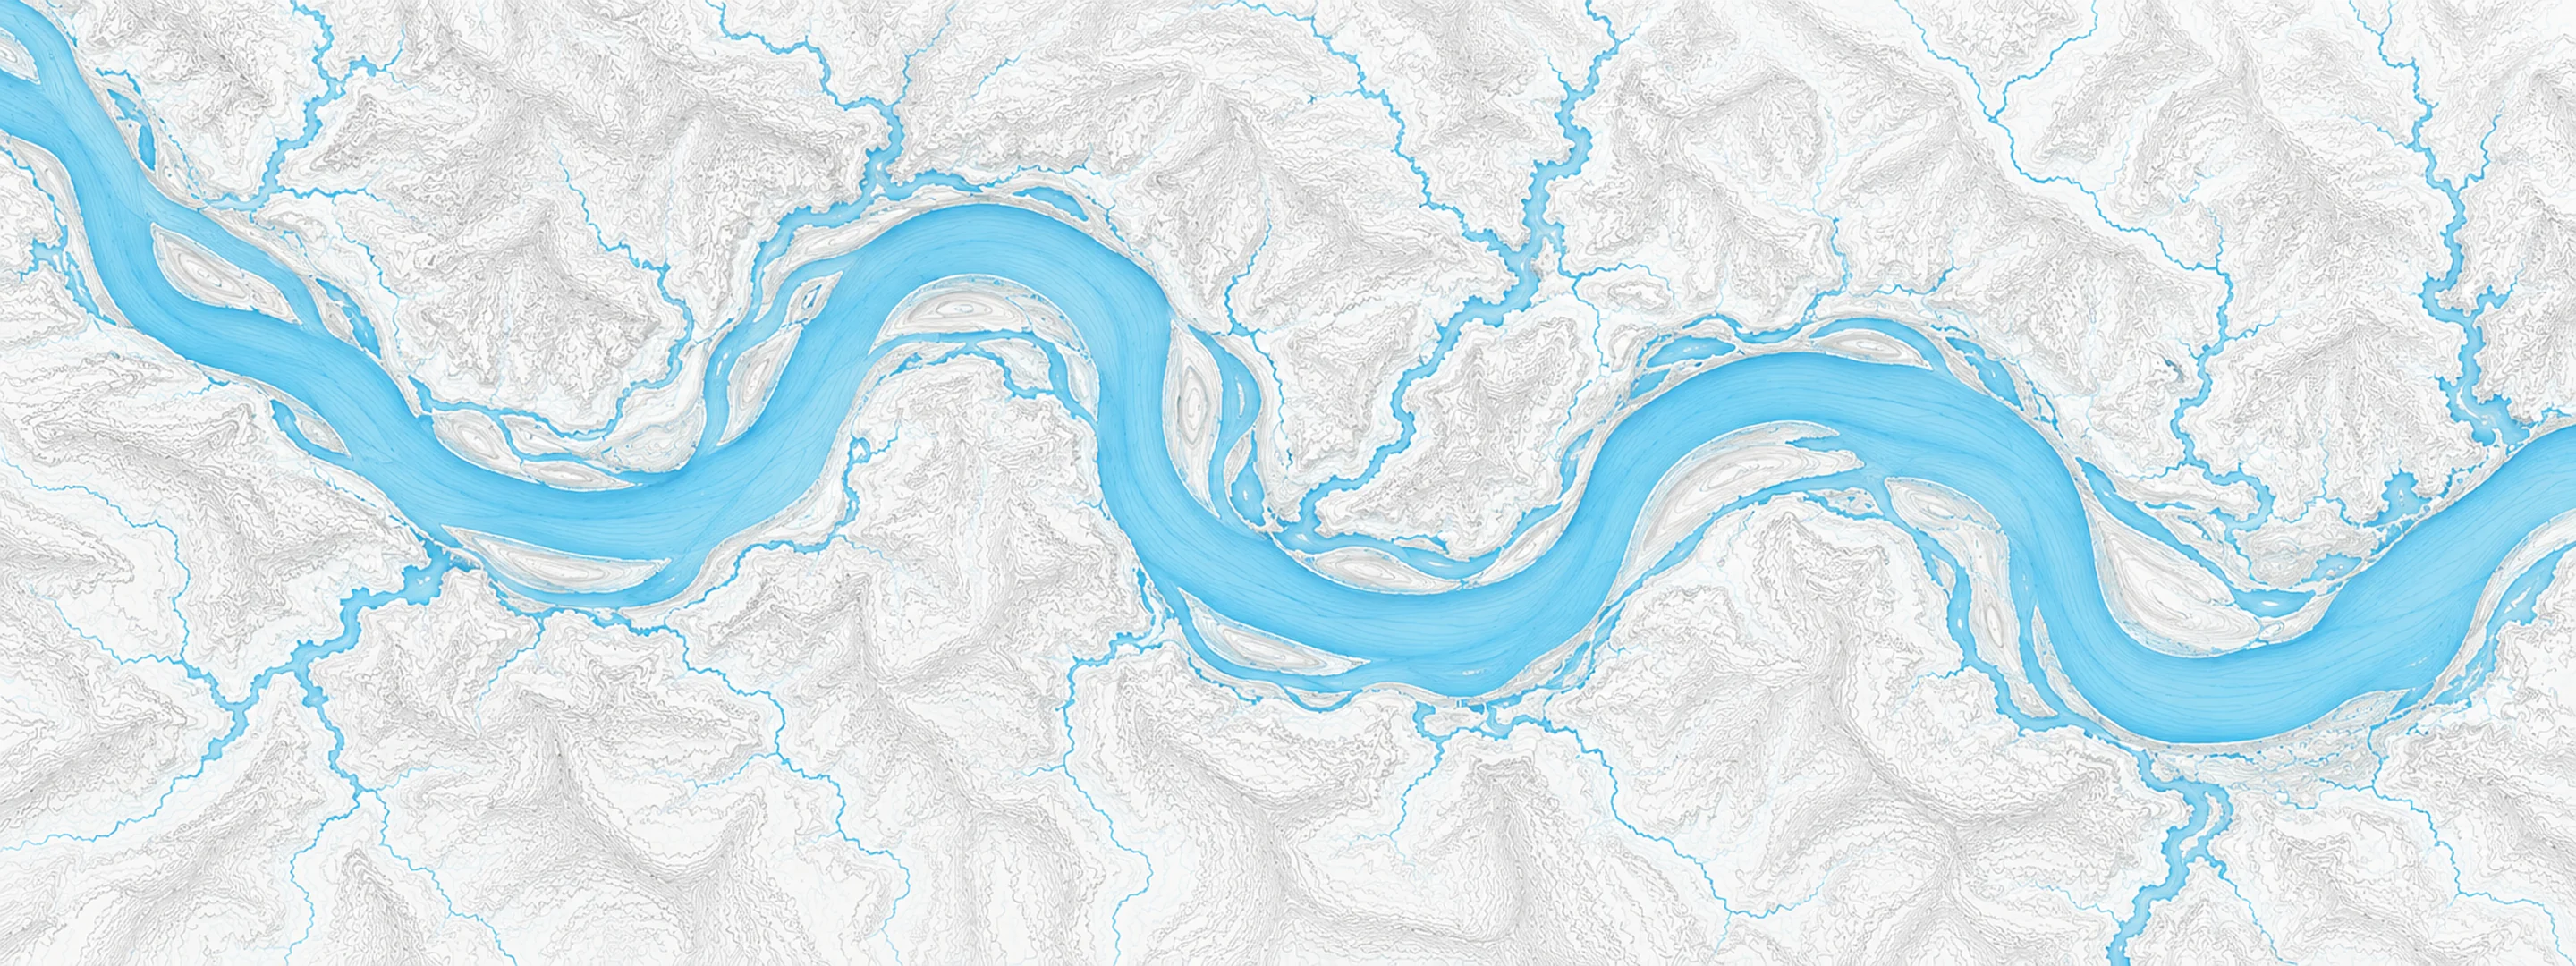
River stage
Ohio River
- River level
- Normal
- Status
- Below flood stage
Latest readings 2026-10-13 | NWS · USGS
- Gauges reporting
- 44 of 44
- Above flood stage
- 0
- Above action stage
- 0
- Overall
- Below flood stage
- Publisher
- NWS · USGS
In brief
On Oct 13, 2026, 44 of 44 gauges on the Ohio River reported, and none was above flood stage.
Source: National Weather Service and USGS gauges
Ohio River levels, gauge by gauge
The Ohio River is measured at 44 gauges across Illinois, Indiana, Kentucky, Ohio, Pennsylvania, West Virginia. Flood stages are set per gauge, so the same river is "high" at one town and normal at the next.
| Location | Level | Status |
|---|---|---|
| Cairo | 20.30 ft | normal, steady |
| Golconda | 30.17 ft | normal, rising |
| Olmsted Lock and Dam Headwater | 22.59 ft | below flood stage |
| Olmsted Lock and Dam Tailwater | 21.08 ft | no flood stage set |
| Shawneetown | 16.95 ft | normal, rising |
| Smithland Lock and Dam | 13.45 ft | below flood stage |
| Cannelton Lock and Dam | 15.45 ft | below flood stage |
| Clifty Creek | 424.86 ft | normal, steady |
| Evansville | 16.18 ft | normal, rising |
| J.T. Myers Lock and Dam | 17.03 ft | below flood stage |
| Newburgh Lock and Dam | 17.27 ft | below flood stage |
| NWS gauge RVPK2 | 17.37 ft | no flood stage set |
| Ashland | 35.31 ft | normal, rising |
| Henderson | 14.04 ft | normal, rising |
| Lloyd Greenup Lock | 24.21 ft | below flood stage |
| Louisville Water Tower | 13.08 ft | no flood stage set |
| Markland Lower | 21.87 ft | normal, rising |
| Maysville | 34.98 ft | normal, rising |
| McAlpine Lower | 20.17 ft | normal, rising |
| McAlpine Upper | 12.67 ft | normal, falling |
| Owensboro | 20.12 ft | normal, steady |
| Paducah | 16.09 ft | normal, falling |
| NWS gauge CCNO1 | 30.44 ft | below flood stage |
| Hannibal Lock and Dam | 13.72 ft | below flood stage |
| Ironton | 34.95 ft | normal, rising |
| Marietta Pumphouse | 17.19 ft | normal, rising |
| Meldahl Dam | 23.65 ft | below flood stage |
| New Cumberland Lock and Dam | 15.09 ft | below flood stage |
| Portsmouth | 23.46 ft | normal, rising |
| Sardis | 13.72 ft | no flood stage set |
| Willow Island Lock | 15.36 ft | below flood stage |
| Dashields Lock and Dam | 15.74 ft | below flood stage |
| Emsworth L/d Pool | 16.72 ft | no flood stage set |
| Emsworth Lock and Dam | 16.00 ft | no flood stage set |
| Montgomery Lock and Dam | 13.77 ft | below flood stage |
| Pittsburgh | 16.88 ft | normal, steady |
| Belleville Lock | 15.15 ft | below flood stage |
| Huntington | 28.02 ft | normal, rising |
| Parkersburg | 22.29 ft | normal, rising |
| Pike Island Lock and Dam | 15.48 ft | below flood stage |
| Point Pleasant | 25.22 ft | normal, rising |
| R C Byrd Lock | 20.91 ft | below flood stage |
| Racine Lock | 15.89 ft | below flood stage |
| Wheeling | 17.04 ft | normal, rising |
Recent levels on the Ohio River
The gauge with the fullest recent record on this river is Golconda, IL, with 122 days of readings.
Other rivers nearby
- Licking River (KY) 9 gauges
- Eagle Creek (KY) 2 gauges
- Elkhorn Creek (KY) 3 gauges
- Mill Creek (OH) 5 gauges
- Little Miami River 4 gauges
- Paint Creek 6 gauges
- Kentucky River 14 gauges
- Red River (KY) 2 gauges
Frequently asked questions
Is the Ohio River flooding right now?
No. Every one of the 44 reporting gauges on the Ohio River is below flood stage as of 2026-10-13.
How high is the Ohio River?
The river is measured at several points and each reads a different height. Cairo is at 20.30 ft; Golconda is at 30.17 ft; Shawneetown is at 16.95 ft; Clifty Creek is at 424.86 ft.
Where is the Ohio River measured?
The National Weather Service and USGS operate 44 gauges on the Ohio River across Illinois, Indiana, Kentucky, Ohio, Pennsylvania, West Virginia.
What does flood stage mean?
Flood stage is the height at which a river begins to cause problems at that specific location. It is set per gauge, so the same river can be above flood stage in one town and normal a few miles downstream. Action stage is the lower level at which forecasters start watching closely.
River stages and flood categories from the NOAA National Weather Service; daily history from the U.S. Geological Survey. For flood safety decisions always follow official National Weather Service warnings.